Measurement systems precision control method
Defne Engineering Ltd. Ltd. He has been working on projects on measurement, backward engineering and product development for over six years. As a result of his experience in the usage areas, sensitivities and capacities of 3D dimensioning systems, he has specialized in the measurement and methodology of very small and very large scale parts and detail geometries. This study provides technical details on measurement techniques and control of small-scale (0.01 – 0.05 mm) details. Today, in the lighting, defense and medical sectors, these details are an important step for both the control of production and the development of new designs.
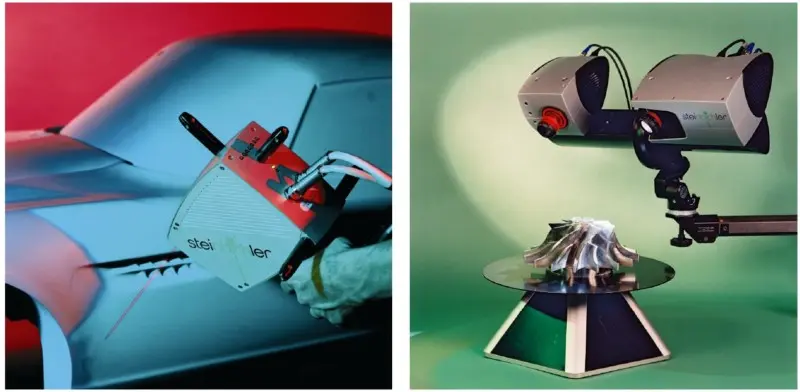
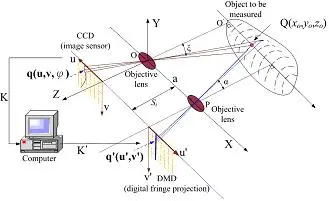
Measurement systems that use the grid projection method, which is an optical scanning system, consists of a camera and a projection group. These systems cast a grid shadow on the product to be measured and convert 2D images into 3D point cloud data, monitored by the camera or cameras on the system. (Figure 1)
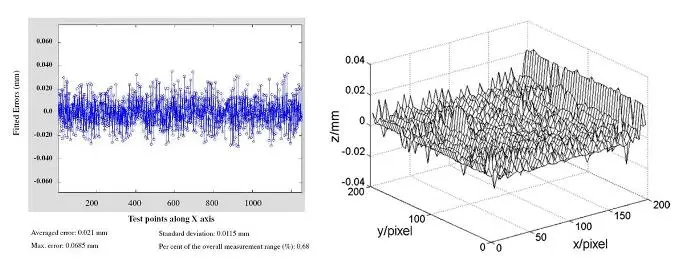
Phase difference algorithm is used to convert 2D images into 3D measurement points. This algorithm creates 3D data with the image processing method, using different algorithms to eliminate errors that may occur in sharp edges and step transitions and to capture such regions more clearly. The mathematical approach used causes roundings to ensure a smoother or sharper transition on both flat surfaces and step transitions. These roundings are defined by a parameter defined as the noise level of the systems. The noise level is given as 10-50 µm (0.01-0.05 mm) in grid projection measurement systems. Figure 2.
In order to capture the 3D data of a product into a computer environment, camera images must be taken in more than one location. The number of images can be between 3 and 100 in order to capture the unmeasurable areas behind and all the features of the product. Data taken from a single angle for measurement will not reflect the values that the system will give in real application. Each measurement taken and their combination causes errors to be combined and accumulated. Measurement and calibration sensitivities and standards of grid projection systems are defined by VDI/VDE Guideline 2634 part1 and 3 standards published in 2002-2008 and 2011. In these standards, measurement methods and values that can be applied to every system regarding noise, sensitivity and calibration are defined. These standards specify how many different angles measurements should be taken. Different from these standards, various scientific studies are being carried out on obtaining more efficient results from systems with different mathematical algorithms or grid reduction methods. (Reference: 1 – 2 – 3).
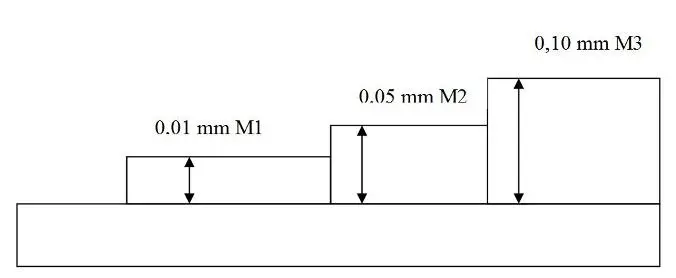
Several test studies were carried out to obtain the performance of 3D measurement systems in real applications, both in precision and detail geometries. Optical measurement system: COMET 5 4Mp system from Steinbichler company was used. As a result of testing the parameters under the control of the user in the software of this system, parameters suitable for the product were defined. The test piece used was prepared with details of 10, 50 and 100 µm (0.01, 0.05 and 0.1 mm). Figure 3. This part was measured from 3 different angles. The point cloud obtained as a result of combining the measurements taken was compared with other measurement methods.
The point cloud data obtained as a result of the measurement is shown in Figure 4. Three different levels are clearly visible in the measurement. Since the process was carried out for the purpose of detailed part measurement of the stages, the part was cleaned with a special solution and no paint or other process was applied to it. The transition zones to each other were fully obtained. All 3 stages physically located on the part could be clearly taken as a result of the measurement.
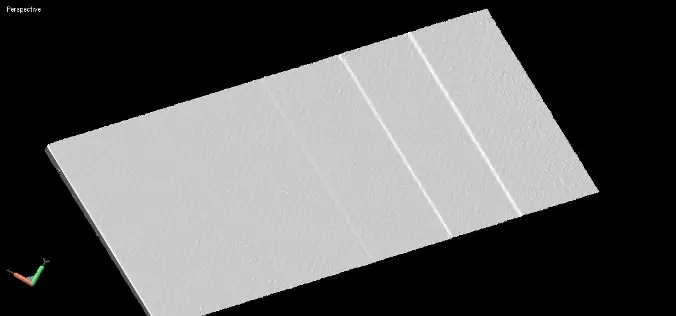
Figure 4: Point cloud data obtained with the grid projection method
Zero, that is, the reference region, was selected by marking on the obtained data. Figure 5
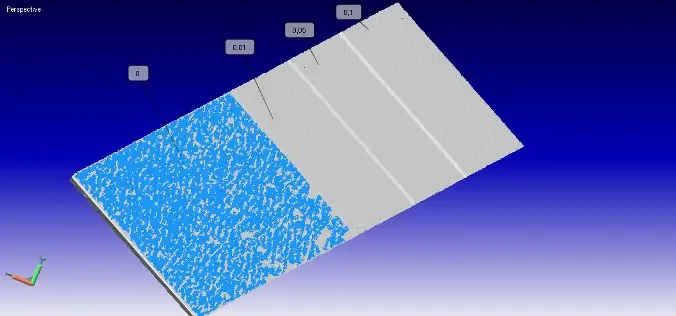
Figure 5: Reference region
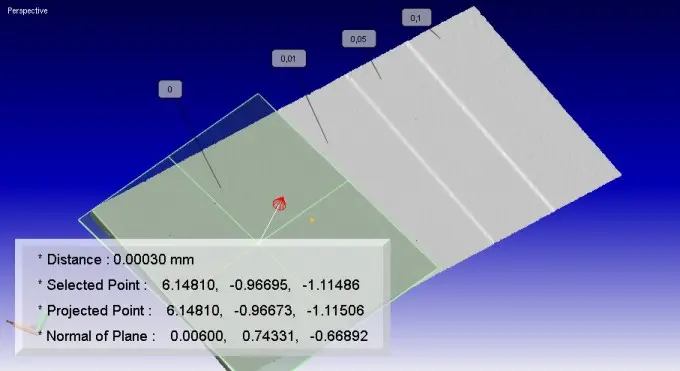
A planar geometry (plane) is defined in the reference region. The average error of the defined plane appears to be 0.0003. Figure 6
Figure 6: reference zone plane definition
Individual measurement of stages starting from the reference plane
values were taken. The measurement values given by the 0.01, 0.05 and 0.1 mm steps are shown in the attached Figure 7. The measurements taken are the distances to the reference plane and the points were chosen randomly. Error amounts of individual points can be seen in detail.
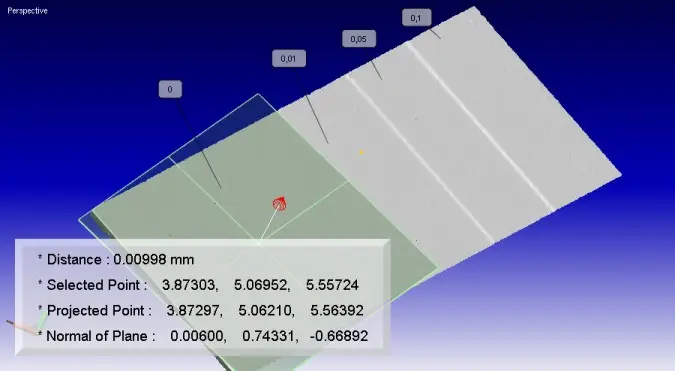
Figure 7: Measurement results of the stages
As a result of comparing the measurement result with the mathematical (CAD) model, regional and general errors are shown in Figure 8. The maximum regional error appears to be -0.004 mm in the 0.1 mm region. Errors in other regions are on average -0.002 mm.
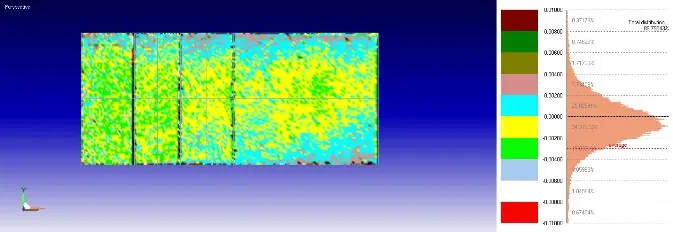
Figure 8: Regional and general errors obtained as a result of comparison with the CAD model
When we turn these errors into a report, the results are seen in Figure 9.
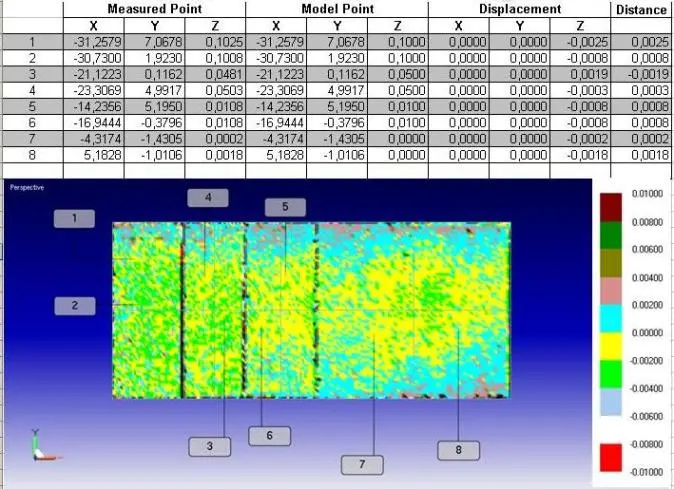
Figure 9: Quality control report
In order to control and verify the measurement results of the test piece, the values obtained with different measurement systems were checked. The first of the measurements made with 2 different systems was made with the Nikon VMA-2520 video measuring system, which is defined as optical measuring (video measuring). In principle, this system measures distance by sharpening the video image taken without touching the product. The second control measurement system was used CMM (coordinate measuring machine). Measurements were taken by touching the product. Point measurement method was preferred in both systems. In other words, point measurements were taken from the regions where the levels were defined as the “zero” level plane, which is accepted as the reference level of the product. Pictures of the work done can be seen in Figure 10.
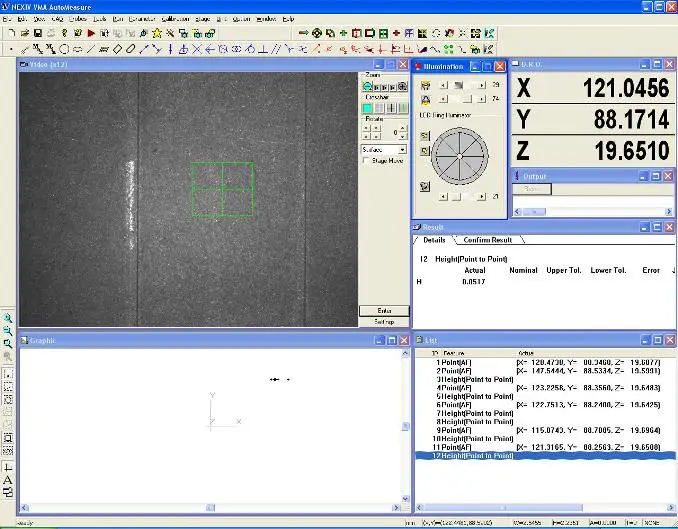
Figure 10: CMM and video measurement system stages.
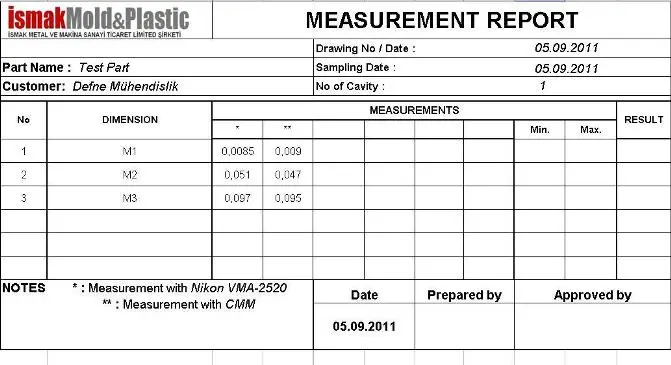
Figure 11: Video streaming and CMM measurement report
The results of measurements made with different methods and systems are presented comparatively in the table below. The references of the grid projection system are taken from the points specified in Figure 9. Since the grid projection system provides samples on the entire surface, it stands out as a more effective method and system in the measurement and quality control of shaped surfaces. The purpose of choosing a planar test piece is to make comparisons with other measurement methods.
| Measurement/method | video projection | CMM | grid projection | |||
| Measurement | Error | Measurement | Error | Measurement | Error | |
| M1 (0.01 mm) | 0,0085 | 0,0015 | 0,0090 | 0,0010 | 0,0108 | 0,0008 |
| M2 (0,05 mm) | 0,0510 | 0,0010 | 0,0470 | 0,0030 | 0,0480 | 0,0020 |
| M3 (0,10 mm) | 0,0970 | 0,0030 | 0,0950 | 0,0050 | 0,1025 | 0,0025 |
The purpose of this study; Determining the starting and ending location of a 0.01 mm detail in the grid projection method shows that it is possible to precisely define the boundaries and value size of such a detail measurement with the grid projection method. There is an intense need for product development and control in many different areas such as prosthetics, mechanical valve systems and lighting elements used in the medical sector. Steps and differences of 0.01 mm and below, especially on the shaped surfaces of the products, can only be captured by the grid projection method. Systems equipped with advanced technology with controlled mechanical and thermal stabilization of grid projection systems can achieve this type of work. Such details in the use of measurement systems can only be overcome with experience and expertise.
Defne Engineering continues to develop its expertise in measurement methodology and quality control methods with its command of different brands and systems and the experience it has gained from different parts types from many sectors. Our company continues to develop and expand its expertise in product design, product development, 3D measurement and quality control. Defne Engineering will continue to provide complete solutions to its customers from design to production.
References :
1- Calibration of 3D surface profilometry using digital fringe projection; MEASUREMENT SCIENCE AND TECHNOLOGY; Meas. Sci. Technol. 16 (2005) 1554–1566; Liang-Chia Chen1 and Chu-Chin Liao
2- Neural network applied to reconstruction of complex objectsbased on fringe projection; Optics Communications 278 (2007) 274–278; Tangy Yan, Chen Wen-jing , Su Xian-yu, Xiang Li-qun
3- Skin topography measurement by interference fringe projection: a technical validation; Skin Research and Technohgy 2001; 7: 332-121; J. M. Lagarde, C. Rouvrais, D. Black, S. DiridoUou and Y. Gall
4- http://www.defnemuhendislik.com/teknik-makaleler/